Notes on Optimizing Clojure Code: Example
Last week, I presented three different ways to measure what's taking up time in a Clojure code base. This week, I'll walk through how to apply those three types of measurements on a concrete use-case: optimizing my AoC day 12 solution.
Starting point
We know from last week that leaving the tufte performance log in the code has only a small impact on performance, so for convenience we'll leave them in. We start from the code we had last week:
(ns t.core
  (:require [taoensso.tufte :as tufte :refer [p]]
            [criterium.core :as crit]
            [clojure.string :as string]
            [clojure.set :as set])
  (:gen-class))

(defn parse
  [lines]
  (->> lines
       (map #(string/split % #"-"))
       (mapcat (fn [[a b]] [{a #{b}} {b #{a}}]))
       (apply merge-with set/union {})))

(defn small?
  [^String s]
  (p :small? (= s (.toLowerCase s))))

(defn ends?
  [[path]]
  (p :ends? (= (last path) "end")))

(defn part2
  [input]
  (loop [num-paths 0
         paths [[["start"] #{"start"} false]]]
    (if (empty? paths)
      num-paths
      (let [paths (for [[path visited twice?] paths
                        next-step (p :next-step
                                     (get input (last path)))
                        :when (p :when
                                 (or (not (visited next-step))
                                     (and (not= "start" next-step)
                                          (not twice?))))]
                    [(p :conj-path (conj path next-step))
                     (p :visited
                        (if (small? next-step)
                          (conj visited next-step)
                          visited))
                     (p :twice-check
                        (or twice?
                            (boolean (visited next-step))))])]
        (recur (p :filter-path
                  (->> paths (filter ends?) count (+ num-paths)))
               (p :remove-ends
                  (->> paths (remove ends?))))))))

(defn bench
  [f]
  (->> (crit/benchmark (f) {}) :mean first))

(defn -main
  [& args]
  (tufte/add-basic-println-handler!
    {:format-pstats-opts {:columns [:total :mean :n-calls :p50 :clock]}})
  (let [input (-> (slurp "day12")
                  (string/split-lines)
                  parse)]
    (when (not= 119760 (part2 input))
      (println "Something went wrong.")
      (System/exit 1))
    (println (format "bench: %.3e" (bench #(part2 input))))
    (tufte/profile {} (dotimes [_ 5] (part2 input)))
    (Thread/sleep 3000)
    (println "Waiting for profiler...")
    (read-line)
    (part2 input)))
I've changed the -main function a bit, so that running it returns all the
data we may want to collect: it will first benchmark the solution, then give us
a tufte profile, and then let us run a VisualVM profile if we want.
It's also checking that we still get the expected answer. This is easy to overlook, when working on performance, but if all you're measuring is performance, you may end up changing the meaning of the code and not noticing right away. In practice you should probably have a more extensive test suite than this.
At this point, running it yields:
bench: 1.190e+00

pId                Total       Mean     nCalls      50% ≤      Clock

:filter-path        100%   152.95ms         80    37.98ms    12.24s
:ends?               27%   850.02ns  3,831,070   543.00ns     3.26s
:tufte/compaction    21%   118.96ms         22    88.57ms     2.62s
:visited              9%   547.01ns  1,915,535   253.00ns     1.05s
:next-step            8%   705.43ns  1,316,740   555.00ns   928.86ms
:when                 6%   143.42ns  5,503,380   136.00ns   789.31ms
:conj-path            1%    85.16ns  1,915,535    70.00ns   163.12ms
:small?               1%    57.41ns  1,915,535    47.00ns   109.97ms
:twice-check          1%    37.78ns  1,915,535    31.00ns    72.36ms
:remove-ends          0%     1.21μs         80     1.46μs    97.07μs

Accounted           173%                                     21.22s
Clock               100%                                     12.25s

Waiting for profiler...
Laziness v. performance?
The first piece of insight we got last week was that laziness seems to be
getting in the way. In our performance logs, it seems to result in all of the
time getting allocated to :filter-path, even though that form should be
reasonably fast and only a small fraction of our total runtime. Profiling
through VisualVM is also made difficult to interpret as the call stack at
runtime does not seem to follow the shape of the code.
So is laziness bad? Let's talk about it in slightly more general terms.
Laziness defers computation. Exactly how that is done depends on the underlying data structures, but generally speaking the approach is to wrap the underlying sequence in a pair of, on the one hand, the first element, and, on the other hand, a function that can be called to get the next pair.
From a performance perspective, this wrapping has a cost, although usually a smaller one than I would expect (the JVM is very good with small, short-lived objects).
From a measurement perspective, it's definitely getting in the way, as we've seen in this example.
So is laziness bad for performance? Well, it depends. One thing laziness allows
us to do is choose whether or not we get the next element. Any time you have a
situation where you stop after finding n elements and you can get there
without processing the entire source sequence, it's likely that laziness is
improving your performance. But that's not the case here. Here, we know that,
on each iteration, we want to process our entire paths. Since we're not
getting any benefit from laziness under these circumstances, let's get rid of
it.
The simplest way to achieve that is to wrap every lazy sequence creation in a
doall call. That function takes a lazy sequence and forces it, then returns
it. This means that, from a performance perspective, we should not expect any
improvement (we're still going through the exact same wrap-unwrap process), but
we should be able to get better measurements.
All of our laziness is in the part2 function, so here is the updated version,
where we just added three doall calls. The rest of the code is unchanged.
(defn part2
  [input]
  (loop [num-paths 0
         paths [[["start"] #{"start"} false]]]
    (if (empty? paths)
      num-paths
      (let [paths (doall (for [[path visited twice?] paths
                               next-step (p :next-step
                                            (get input (last path)))
                               :when (p :when
                                        (or (not (visited next-step))
                                            (and (not= "start" next-step)
                                                 (not twice?))))]
                           [(p :conj-path (conj path next-step))
                            (p :visited
                               (if (small? next-step)
                                 (conj visited next-step)
                                 visited))
                            (p :twice-check
                               (or twice?
                                   (boolean (visited next-step))))]))]
        (recur (p :filter-path
                  (->> paths (filter ends?) doall count (+ num-paths)))
               (p :remove-ends
                  (->> paths (remove ends?) doall)))))))
Hopefully, we should now spend little time in :filter-path, and, when
profiling with VisualVM, similarly little time in count.
Here's the output:
bench: 1.364e+00

pId                Total       Mean     nCalls      50% ≤      Clock

:ends?               24%   807.06ns  3,831,070   590.00ns     3.09s
:filter-path         23%    36.82ms         80    10.82ms     2.95s
:tufte/compaction    20%   119.67ms         22    94.85ms     2.63s
:remove-ends         18%    28.65ms         80    10.85ms     2.29s
:next-step            8%   757.98ns  1,316,740   632.00ns   998.06ms
:visited              7%   471.56ns  1,915,535   248.00ns   903.29ms
:when                 6%   144.76ns  5,503,380   136.00ns   796.68ms
:conj-path            1%    82.13ns  1,915,535    69.00ns   157.33ms
:small?               1%    57.33ns  1,915,535    47.00ns   109.82ms
:twice-check          1%    37.00ns  1,915,535    30.00ns    70.88ms

Accounted           108%                                     14.00s
Clock               100%                                     12.97s

Waiting for profiler...
We seem to have a little bit of an overhead for the doall calls we added
(which is somewhat expected: we're forcing an extra traversal of paths), but
more importantly we're no longer spending all our time in :filter-path. The
form we spend the most time in is :ends?, closely followed by :filter-path.
But remember that :filter-path contains a call (or many) to ends?, so we
really should be focusing on :ends? first.
Data structures and abstractions
If you're familiar enough with the Clojure core library and its performance
characteristics, the problem with :ends? as defined may be immediately
apparent to you; if you're not, maybe the VisualVM output can help. Here is
the relevant section:
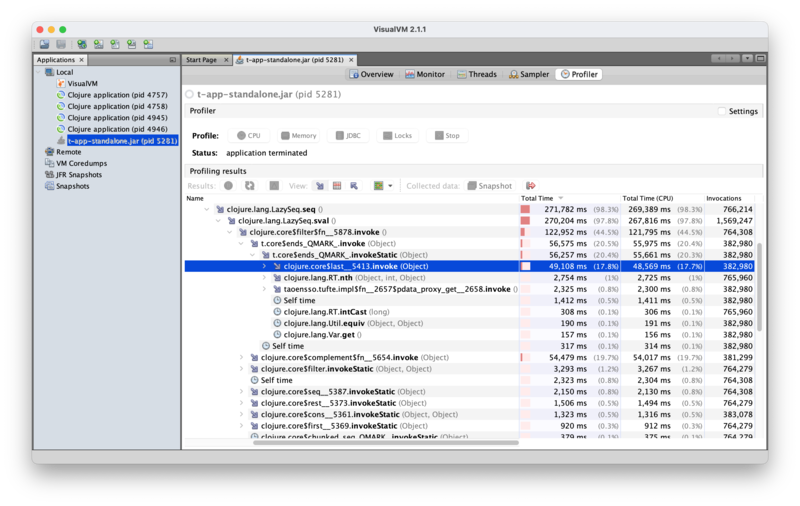
So most of the time spent in ends? is spent on last; =
(Clojute.lang.Util.equiv) seems pretty negligible in comparison. If you dig
into the details of last, you'll see that it is transforming its vector
argument into a seq, then traversing it one element at a time.
This is because last is a function that acts on the seq abstraction. But in
this case, we know we're always calling ends? with a vector, and vectors
have near-constant-time indexed access, as well as constant-time count. So we
could instead do something like:
(defn ends?
  [[path]]
  (p :ends?
    (let [c (count path)
          e (get path (dec c))]
      (= e "end"))))
While that would work, there's already a function in the standard library to do
exactly that: peek. Unlike last, which only works on sequences and
converts its argument to a seq before processing it, peek is a polymorphic
function that acts differently based on the type of its argument. On a seq, it
returns the first element; on a vector, it returns the last element; on a
queue, it returns the head of the queue. In other words, it's always fast.
So let's go with that instead:
(defn ends?
  [[path]]
  (p :ends? (= (peek path) "end")))
Running the code again, we get:
bench: 8.416e-01

pId                Total       Mean     nCalls      50% ≤      Clock

:tufte/compaction    24%   110.32ms         22    90.20ms     2.43s
:filter-path         11%    14.62ms         80     6.09ms     1.17s
:visited             11%   589.39ns  1,915,535   254.00ns     1.13s
:remove-ends         11%    13.80ms         80     4.50ms     1.10s
:next-step            9%   741.53ns  1,316,740   492.00ns   976.40ms
:when                 8%   145.46ns  5,503,380   139.00ns   800.52ms
:conj-path            5%   286.28ns  1,915,535    65.00ns   548.39ms
:ends?                5%   142.54ns  3,831,070   134.00ns   546.08ms
:small?               1%    55.83ns  1,915,535    46.00ns   106.94ms
:twice-check          1%    36.89ns  1,915,535    31.00ns    70.66ms

Accounted            86%                                      8.88s
Clock               100%                                     10.31s

Waiting for profiler...
This is definitely an good improvement (~1.2s to ~0.84s), but let's not be too
short-sighted here. Taking a step back, in order to be confident we can make
this change, we had to trace through all the calls to ends? and check where
the argument comes from. In doing that, we should have noticed that:
- The argument to
ends?is always created from["start"], by successive calls to(conj path next-step). pathis only ever used by being passed toends?, which callslaston it, or tolast(in:next-step).
The first observation here is what allows us to change last to peek (which,
incidentally, we could also do in :next-step): if the only thing we ever
do with that vector is get its last element, we'll get it faster if we use a
vector-appropriate function. But we'll get it even faster if we don't have a
vector at all: clearly all we care about is our current position, not the path
that got us there. (More accurately, what we care about from the path is
already covered by visited and twice?.)
Keeping only the current position requires changes to both ends? and part2.
Here are the new versions. The rest of the code is unchanged.
(defn ends?
  [[pos]]
  (p :ends? (= pos "end")))

(defn part2
  [input]
  (loop [num-paths 0
         paths [["start" #{"start"} false]]]
    (if (empty? paths)
      num-paths
      (let [paths (doall (for [[pos visited twice?] paths
                               next-step (p :next-step
                                            (get input pos))
                               :when (p :when
                                        (or (not (visited next-step))
                                            (and (not= "start" next-step)
                                                 (not twice?))))]
                           [next-step
                            (p :visited
                               (if (small? next-step)
                                 (conj visited next-step)
                                 visited))
                            (p :twice-check
                               (or twice?
                                   (boolean (visited next-step))))]))]
        (recur (p :filter-path
                  (->> paths (filter ends?) doall count (+ num-paths)))
               (p :remove-ends
                  (->> paths (remove ends?) doall)))))))
I don't expect a big performance difference here, because vector access is
quite fast and at this point :ends? is not a big part of our runtime anymore,
but this is a nice code simplification. Still, here is the new output:
bench: 6.503e-01

pId                Total       Mean     nCalls      50% ≤      Clock

:tufte/compaction    30%   136.35ms         20   126.24ms     2.73s
:filter-path         13%    15.25ms         80     4.45ms     1.22s
:remove-ends         12%    14.23ms         80     3.21ms     1.14s
:visited             11%   529.51ns  1,915,535   242.00ns     1.01s
:when                 9%   147.50ns  5,503,380   139.00ns   811.75ms
:ends?                3%    73.34ns  3,831,070    71.00ns   280.96ms
:next-step            2%   124.51ns  1,316,740   124.00ns   163.95ms
:small?               1%    55.55ns  1,915,535    46.00ns   106.41ms
:twice-check          1%    37.25ns  1,915,535    30.00ns    71.35ms

Accounted            82%                                      7.53s
Clock               100%                                      9.23s

Waiting for profiler...
Well, I must say that surprised me. I did not expect that much of an improvement from removing those vectors.
When your instrumentation gets in the way
We've now reached a slightly awkward situation for tufte, as, per its own
report, it is now taking the majority of our time. As I mentioned last week,
it may not be a great idea to have tufte p calls in the middle of a tight
loop, which definitely does seem to be what we're doing here given the number
of calls to :when, :ends?, etc.
So let's remove all of those and instead consolidate our performance logs on bigger items:
(defn small?
  [^String s]
  (= s (.toLowerCase s)))

(defn ends?
  [[pos]]
  (= pos "end"))

(defn part2
  [input]
  (loop [num-paths 0
         paths [["start" #{"start"} false]]]
    (if (empty? paths)
      num-paths
      (let [paths (p :paths
                     (doall (for [[pos visited twice?] paths
                                  next-step (get input pos)
                                  :when (or (not (visited next-step))
                                            (and (not= "start" next-step)
                                                 (not twice?)))]
                              [next-step
                               (if (small? next-step)
                                 (conj visited next-step)
                                 visited)
                               (or twice?
                                   (boolean (visited next-step)))])))]
        (recur (p :filter-path
                  (->> paths (filter ends?) doall count (+ num-paths)))
               (p :remove-ends
                  (->> paths (remove ends?) doall)))))))
This will give us less specific insights, but hopefully will also no longer get in the way as much. And we can still use VisualVM for more fine-grained insights if and when that's necessary. As a bonus, the call stack in VisualVM will also be a bit easier to read without the tufte calls.
The new result is obviously shorter:
bench: 6.189e-01

pId           Total       Mean     nCalls      50% ≤      Clock

:paths          71%    32.48ms         80    11.13ms     2.60s
:filter-path    15%     7.02ms         80     3.02ms   561.79ms
:remove-ends    14%     6.48ms         80     2.02ms   518.16ms

Accounted      100%                                      3.68s
Clock          100%                                      3.68s

Waiting for profiler...
And comes with a small additional speed bump.
Double duty
Usually we would now focus on :paths as that's the top-level entry. But it's
also a bit unclear what's going on there, as we were previously getting
performance logs for pretty much each operation in it and they added to a lot
less than 71% of runtime.
Let's ignore that for a minute, and take a look at the two other entries. One
important point to note about them is that they are doing the same thing:
they both walk down the paths sequence and call ends? on each element. We
know from previous measurements of :ends? that the function call itself is
not taking much time, but still, we're traversing twice.
We could traverse that sequence only once by using the core function
group-by. It's a fairly simple change:
(defn part2
  [input]
  (loop [num-paths 0
         paths [["start" #{"start"} false]]]
    (if (empty? paths)
      num-paths
      (let [paths (p :paths
                     (doall (for [[pos visited twice?] paths
                                  next-step (get input pos)
                                  :when (or (not (visited next-step))
                                            (and (not= "start" next-step)
                                                 (not twice?)))]
                              [next-step
                               (if (small? next-step)
                                 (conj visited next-step)
                                 visited)
                               (or twice?
                                   (boolean (visited next-step)))])))
            {ended true ongoing false} (p :group-by
                                          (group-by ends? paths))]
        (recur (p :filter-path (->> ended count (+ num-paths)))
               (p :remove-ends ongoing))))))
This gives us another small boost:
bench: 5.732e-01

pId           Total       Mean     nCalls      50% ≤      Clock

:paths          81%    35.45ms         80    11.73ms     2.84s
:group-by       19%     8.48ms         80     3.56ms   678.61ms
:filter-path     0%   605.14ns         80   528.00ns    48.41μs
:remove-ends     0%    34.75ns         80    35.00ns     2.78μs

Accounted      100%                                      3.51s
Clock          100%                                      3.52s

Waiting for profiler...
for
We're spending about 20% of our time traversing a sequence we just created. We
could, instead, categorize each new path as we discover it. This would require
us to break the for macro call into less opaque function calls, and introduce
a nested loop.
for is an expressive macro, and it's really nice to use in many cases. But
it's just not the best at performance.
Let's first get rid of the for call:
(defn part2
  [input]
  (loop [num-paths 0
         paths [["start" #{"start"} false]]]
    (if (empty? paths)
      num-paths
      (let [paths (p :paths
                     (->> paths
                          (mapcat
                            (fn [[pos visited twice?]]
                              (->> (get input pos)
                                   (filter (fn [next-step]
                                             (or (not (visited next-step))
                                                 (and (not= "start" next-step)
                                                      (not twice?)))))
                                   (map (fn [next-step]
                                          [next-step
                                           (if (small? next-step)
                                             (conj visited next-step)
                                             visited)
                                           (or twice?
                                               (boolean (visited next-step)))])))))
                          doall))
            {ended true ongoing false} (p :group-by
                                          (group-by ends? paths))]
        (recur (p :filter-path (->> ended count (+ num-paths)))
               (p :remove-ends ongoing))))))
This yields:
bench: 6.380e-01

pId           Total       Mean     nCalls      50% ≤      Clock

:paths          80%    36.55ms         80    13.28ms     2.92s
:group-by       20%     9.08ms         80     3.63ms   726.41ms
:filter-path     0%   741.23ns         80   699.00ns    59.30μs
:remove-ends     0%    51.56ns         80    35.00ns     4.13μs

Accounted      100%                                      3.65s
Clock          100%                                      3.65s

Waiting for profiler...
Which is slightly slower but has a similar breakdown. Now, let's turn that into a loop rather than first building a sequence and then traversing it:
(defn part2
  [input]
  (loop [num-paths 0
         paths [["start" #{"start"} false]]
         next-steps ()
         visited #{}
         twice? false]
    (cond (and (empty? next-steps) (empty? paths))
          num-paths
          (empty? next-steps)
          (let [[pos visited twice?] (first paths)]
            (recur num-paths (rest paths) (get input pos) visited twice?))
          (= (first next-steps) "end")
          (recur (inc num-paths) paths (rest next-steps) visited twice?)
          :else
          (let [next-step (first next-steps)]
            (if (p :ongoing?
                   (or (not (visited next-step))
                       (and (not= "start" next-step)
                            (not twice?))))
              (recur num-paths
                     (conj paths (p :build-path
                                    [next-step
                                     (if (small? next-step)
                                       (conj visited next-step)
                                       visited)
                                     (or twice?
                                         (boolean (visited next-step)))]))
                     (rest next-steps)
                     visited
                     twice?)
              (recur num-paths paths (rest next-steps) visited twice?))))))
This is a pretty big change. This is where it's important to have at least some
amount of tests. There's also some guesswork as to where to place the p tags
and how they will relate to what we were measuring before.
Did we gain anything?
bench: 3.478e-01

pId                Total       Mean     nCalls      50% ≤      Clock

:tufte/compaction    16%    99.16ms          7    75.59ms   694.15ms
:ongoing?            15%   135.37ns  4,904,580   140.00ns   663.94ms
:build-path           6%   180.37ns  1,316,735    91.00ns   237.50ms

Accounted            37%                                      1.60s
Clock               100%                                      4.28s

Waiting for profiler...
We've just about doubled our speed. I think we've also reached the limits of
what tufte can do for us here, as recur calls cannot be tagged and every
iteration is now basically our tight loop.
So let's just remove all of tufte and rely on VisualVM from now on. This yields a negligible improvement:
bench: 3.348e-01
Data structures again
Running that code under VisualVM, though, doesn't appear all that helpful at first. Here's what we get:
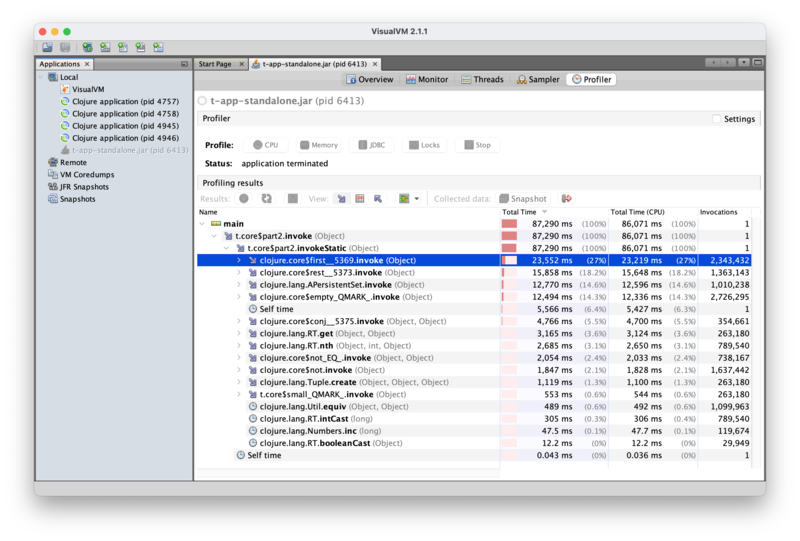
We're spending most of our time in first, rest, empty? and the set
operation on visited. There is no immediately obvious way to make those
faster, as they are part of the core Clojure library. There's also no obvious
way to not call them: we do need to iterate through these collections, and
check whether we've already visited a node.
But if we dig a tiny bit deeper, we can see from the details of the VisualVM
call stacks that we're actually calling first and rest on
"clojure.lang.APersistentMap$KeySeq". Those are actually the sets we get from
parse. Sets are complicated trees with hashing and stuff, so it may be
expected that getting an element out of them, or removing an element, can be a
bit tricky.
Just for fun, let's try turning those into lists: lists could be faster to
traverse using first and rest; lists are much simpler and these operations
map directly to their structure. Maybe. And we don't need those to be sets in
any way: the main point of using sets was to remove duplicates, which is nice,
but we don't do any set operation after that.
(defn parse
  [lines]
  (->> lines
       (map #(string/split % #"-"))
       (mapcat (fn [[a b]] [{a #{b}} {b #{a}}]))
       (apply merge-with set/union {})
       (reduce (fn [m [k v]]
                 (assoc m k (into () v)))
               {})))
We've just added that final reduce, so that when we generate next-steps in
part2, we get a plain list instead of a set.
Here's the result:
bench: 2.258e-01
So it does seem to make a difference. And now, looking at VisualVM, we can
see that the set operation on visited dominates:
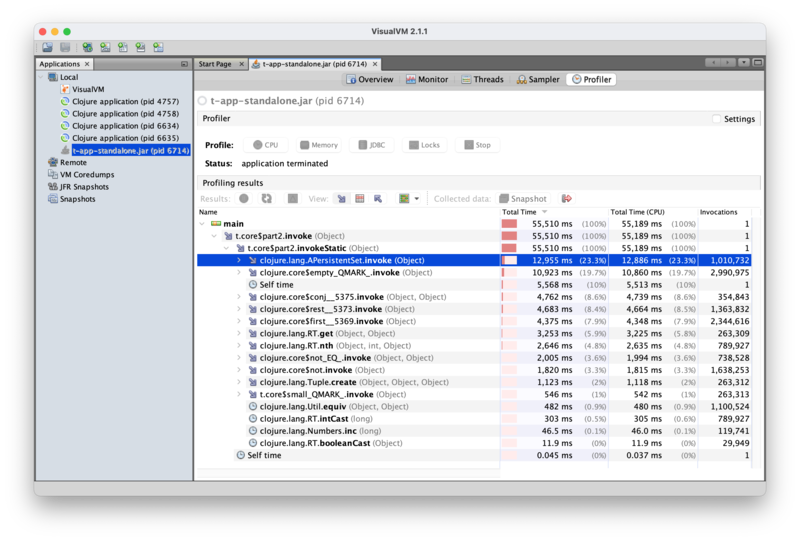
Looking through the details can give us additional insights into this code:
- Most of the time spent in
conjis spent on adding elements to a set (i.e.visited), as opposed to, say, constructing paths. restis called exactly once on a vector (which we can deduce happens on the very first iteration, whenpathsis a vector), and thereafter is always called on a list, which should be where it's most efficient.- Likewise for
first. - We're spending about 5% of our time on
nth, which doesn't appear explicitly in our code. From experience, I suspect this is actually what our[pos visited twice?]destructuring desugars to. Since we know we're always operating on a vector there (which VisualVM confirms), we could probably gain a bit of performance by turning that into three calls togetinstead.1
Conclusion
That's it for today. There are ways to make this faster still, but that requires some techniques that go a bit further than what I've presented last week, so I want to talk about those techniques first before coming back to this example to apply them.
This is because, like
↩lastv.peek,nthalways acts on a seq whereasgetis polymorphic and will thus use the fast indexing of the underlying vector.