Notes on Optimizing Clojure Code: Measurements
Picking up from last week, we'll delve into the three types of measurements I talked about. Let's jump right in; if you want more context, you can read the previous post.
Performance logging
At its most basic, performance logging can just be timestamping your logs. (Or
wrapping some parts of your code in time calls as we did last week.) In
many cases that will be enough to give you a rough idea of which parts of your
code are slow, and sometimes that's enough.
The less linear your code is, the less effective that naive approach will be. My tool of choice for performance logging is tufte, which was extracted from the timbre logging library. Compared to just adding timestamps to your existing logs, its main advantage is that it will compute summarized times for you.
At its most basic, the tufte library can be understood in terms of two constructs:
- The
pmacro takes a keyword and an expression, and returns the result of that expression. It also, through side-effects, registers the time it took to compute that results under the given keyword, if performance logging is enabled in the current dynamic scope. - The
profilemacro takes an option map and a single expression and returns its result, but also, through side-effects, enables performance logging in its dynamic scope.
What the profile macro does with the logs it collects depends on the
registered adapters. This mechanism is very flexible; here, we're going to use
the simple "print summary to stdout" adapter to collect the logs.
There's a lot that can be built out of those primitives (and a lot more tools in the tufte toolbox), but even with just those primitive we get a number of important benefits:
- This gives us an easy way to get a good sense of where time is spent, at a fairly fine-grained level.
- The library is designed to be low-overhead, such that these performance logs
can be left in the code that actually runs in production. Obviously there is
still some overhead so you may not want to put a
pcall in the middle of your tightest loop, but it may be good enough to wrap the entire loop itself in ap. - This can provide some insight after-the-fact, but you have to know in advance which sections of code you want to measure. In general, this will tell you which parts of your code are slow, but not necessarily why.
Here's how it could work concretely on our sample code (my solution to AoC 12):
(ns t.core
  (:require [taoensso.tufte :as tufte :refer [p]]
            [clojure.string :as string]
            [clojure.set :as set])
  (:gen-class))

(defn parse
  [lines]
  (->> lines
       (map #(string/split % #"-"))
       (mapcat (fn [[a b]] [{a #{b}} {b #{a}}]))
       (apply merge-with set/union {})))

(defn small?
  [^String s]
  (p :small? (= s (.toLowerCase s))))

(defn ends?
  [[path _]]
  (p :ends? (= (last path) "end")))

(defn part2
  [input]
  (loop [num-paths 0
         paths [[["start"] #{"start"} false]]]
    (if (empty? paths)
      num-paths
      (let [path (for [[path visited twice?] paths
                       next-step (p :next-step
                                    (get input (last path)))
                       :when (p :when
                                (or (not (visited next-step))
                                    (and (not= "start" next-step)
                                         (not twice?))))]
                   [(p :conj-path (conj path next-step))
                    (p :visited
                       (if (small? next-step)
                         (conj visited next-step)
                         visited))
                    (p :twice-check
                       (or twice?
                           (boolean (visited next-step))))])]
        (recur (p :filter-path
                  (->> path (filter ends?) count (+ num-paths)))
               (p :remove-ends
                  (->> path (remove ends?))))))))

(defn -main
  [& args]
  ; enable "print to stdout" adapter
  (tufte/add-basic-println-handler!
    {:format-pstats-opts {:columns [:total :mean :n-calls :p50 :clock]}})
  (tufte/profile
    {}
    (let [input (p :parse
                   (-> (slurp "day12")
                       (string/split-lines)
                       parse))]
      (part2 input)))
  ; Tufte println reporting is asynchronous, and won't happen if the main
  ; thread exits the application before it's done.
  (Thread/sleep 5000)
  (flush))
Running this yields:
pId                Total       Mean     nCalls      50% ≤      Clock

:filter-path        100%   204.25ms         16   122.64ms     3.27s
:ends?               31%     1.31μs    766,214   626.00ns     1.01s
:next-step           13%     1.63μs    263,348   654.00ns   429.78ms
:tufte/compaction    12%    99.72ms          4   124.42ms   398.89ms
:visited              8%   713.30ns    383,107   337.00ns   273.27ms
:when                 6%   168.63ns  1,100,676   154.00ns   185.60ms
:conj-path            1%   118.07ns    383,107    81.00ns    45.24ms
:small?               1%    70.81ns    383,107    61.00ns    27.13ms
:twice-check          1%    46.85ns    383,107    36.00ns    17.95ms
:parse                0%     6.48ms          1     6.48ms     6.48ms
:remove-ends          0%     3.63μs         16     4.25μs    58.14μs

Accounted           173%                                      5.66s
Clock               100%                                      3.28s
From this, we can immediately make a few observations:
- We spend a lot of time in
ends?. It's a very short function so, hopefully, analyzing and improving it will be fairly straightforward. - Most of the runtime seems to be spent inside the one
filter-pathexpression. This may seem surprising at first, as it is such a small part of the code. We'll see in a minute why that is so.
Profiling
Profiling is generally done by running code under a profiler, which in our case is a tool that attaches to a running JVM and dynamically adds all sorts of instrumentation to the existing classes.
This means that the code you are profiling is not the code that would run under normal circumstances. Specifically, profiling makes code a lot slower, and may interfere with JIT optimizations.
On the other hand, profiling can give you a very detailed understanding of
exactly which operations your code is going through, and where time is spent.
Whereas performance logging could easily tell you which chunk of code is taking
up most of the time (here the :filter-path expression), a profiler will allow
you to dig a bit deeper into the corresponding dynamic call stack, hopefully
allowing you to understand why time is spent there.
My tool of choice for profiling is VisualVM, mostly because it's free and I'm used to it.
It's pretty easy to run, but there are two small catches. First, you need a
running process to attach the profiler to. We can just add a pause to our
-main function:
(defn -main
  [& args]
  ; enable "print to stdout" adapter
  (tufte/add-basic-println-handler!
    {:format-pstats-opts {:columns [:total :mean :n-calls :p50 :clock]}})
  ; give the human user a chance to start the profiler before the program
  ; starts
  (println "Waiting for profiler...")
  (read-line)
  (tufte/profile
    {}
    (let [input (p :parse
                   (-> (slurp "day12")
                       (string/split-lines)
                       parse))]
      (part2 input)))
  ; Tufte println reporting is asynchronous, and won't happen if the main
  ; thread exits the application before it's done.
  (Thread/sleep 5000)
  (flush))
The second catch is that the profiler needs to be able to replace code on the
fly, and that is generally not accepted by the JVM security policy. The easiest
way to bypass that is to turn off code verification. I am definitely NOT
recommending that you turn this off in production, but for local performance
investigation that should be fine. This is done by adding the -Xverify:none
argument to the JVM invocation.
So we can do:
$ lein uberjar && java -Xverify:none -jar target/uberjar/t-app-standalone.jar
Compiling t.core
Created /Users/gary/cuddly-octo-palm-tree/blog/minicode/2022-01-16/target/uberjar/t-app.jar
Created /Users/gary/cuddly-octo-palm-tree/blog/minicode/2022-01-16/target/uberjar/t-app-standalone.jar
lein uberjar  23.19s user 4.10s system 212% cpu 12.818 total
OpenJDK 64-Bit Server VM warning: Options -Xverify:none and -noverify were deprecated in JDK 13 and will likely be removed in a future release.
Waiting for profiler...
At this point the program is waiting for the user to input anything (or nothing) and then press Enter. Before doing that, we can start VisualVM, which will present us with a screen that looks roughly like this:
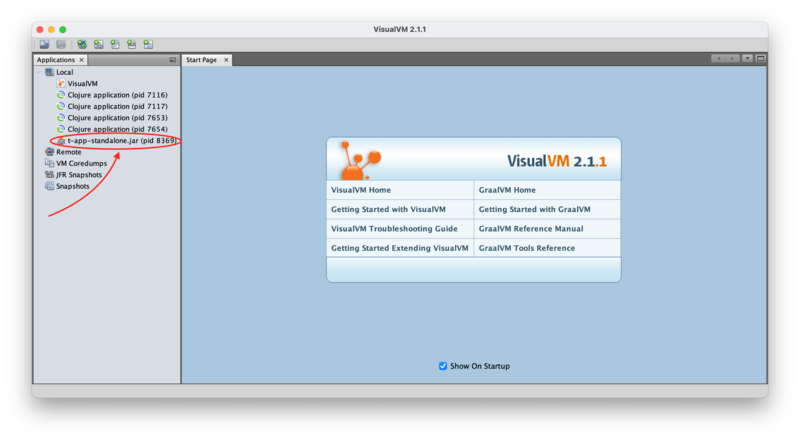
It should autodetect, and list, all of the running JVM processes on the local
machine. As you can see in this screenshot, I had four Clojure processes
running (actually two Leiningen invocations; Leiningen generally starts two
JVMs: one for itself and one for the program), and my java -jar command.
Double-clicking on the highlighted entry then choosing the Profiler tab shows
this:
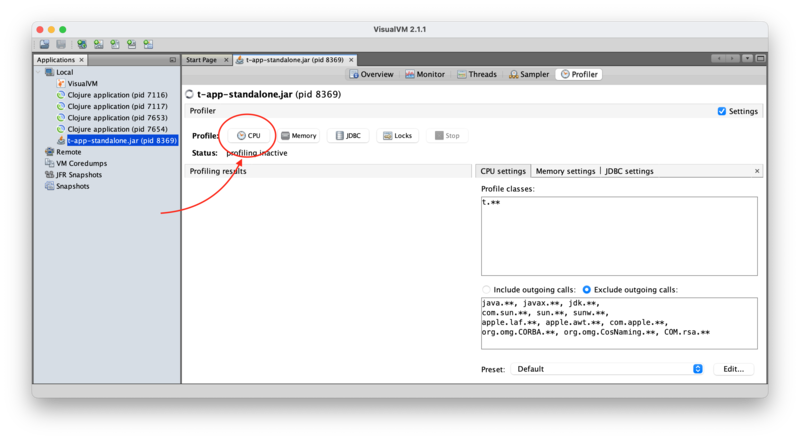
As you can see, there are a number of options to choose from. For this quick
introduction, we'll just keep all of the defaults and click the highlighted
CPU button. This should trigger a little bit of output from our java -jar
command, then stop. Our application is still waiting for input, and VisualVM
only replaces profiled code lazily, when it gets run for the first time after
attaching.
If we then select the terminal with the waiting java -jar command and press
Enter, a bunch of output should appear in the style of:
Profiler Agent: 250 classes cached.
Profiler Agent: Redefining 100 classes at idx 0, out of total 500
After a while, that should calm down, and the computation will proceed. You
should get one entry for main in the profiling table, with a running Total Time value that increases over time, a little bit slower than by one second
every second (about three times slower on my laptop).
You can start looking at the results immediately, but I prefer to wait for the
entire process to be over. In this case, running the code without a profiler
only takes about three seconds; running the code under VisualVM profiling takes
about 28 minutes as measured by my shell (which therefore includes some "manual" time
for launching VisualVM and clicking around in it), and 593s in the reported
Total Time column of VisualVM.
So, yeah. As I mentioned, profiling slows things down a bit.
Here's the output of that run:
pId                Total       Mean     nCalls      50% ≤      Clock

:filter-path        100%     1.73m          16    32.97s     27.73m
:tufte/compaction    28%     1.92m           4     1.87m      7.70m
:ends?               24%   516.89μs    766,214   488.80μs     6.60m
:next-step            9%   553.06μs    263,348   522.47μs     2.43m
:when                 5%    74.38μs  1,100,676    70.61μs     1.36m
:visited              4%   177.58μs    383,107   151.86μs     1.13m
:conj-path            1%    29.67μs    383,107    27.32μs    11.37s
:parse                0%     4.31s           1     4.31s      4.31s
:twice-check          0%     5.07μs    383,107    40.00ns     1.94s
:small?               0%     3.55μs    383,107     3.23μs     1.36s
:remove-ends          0%    67.40μs         16    51.24μs     1.08ms

Accounted           170%                                     47.27m
Clock               100%                                     27.86m
So, what did we gain in exchange for all that time? Well, now we have a profile in VisualVM that we can dig through. This should, hopefully, give us some good insights about what's happening in our code.
There isn't much magic to this, but it does take some practice to become
proficient in "reading" the profiling results. In our case, let's expand the
main node:
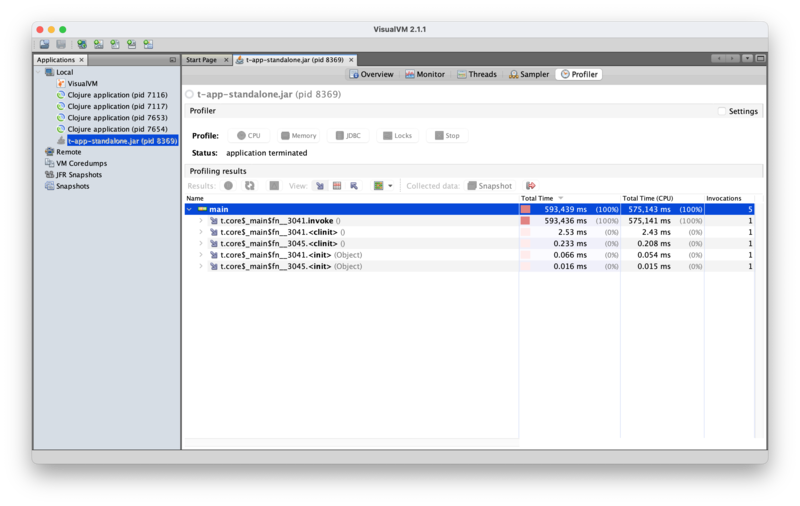
This main here is actually the name of the thread (top-level entries in
VisualVM always are), so this tells us that over its whole lifespan, this
thread called 5 functions, one of which takes up 100% of the time and therefore
four of which we can completely ignore.
The process here is basically to keep expanding the 100% node (they are ordered by percentage, so that will be the first node) until we reach a point where there isn't a single node taking 100% of the runtime. In this case, we reach this point:
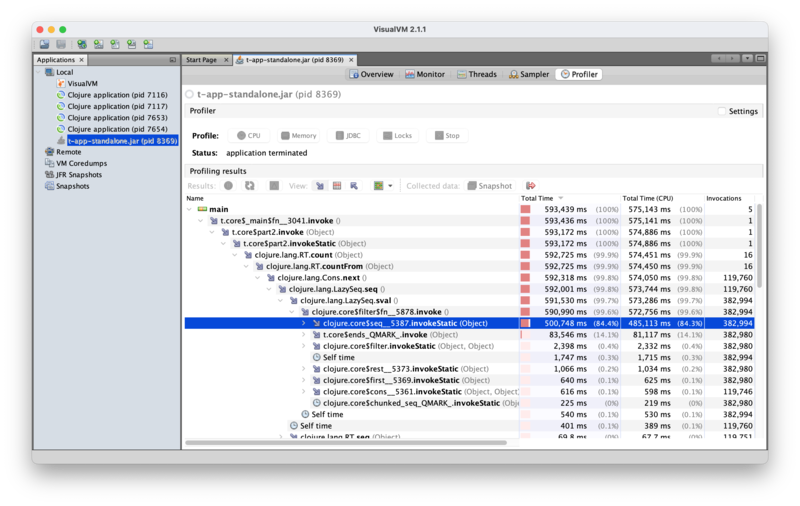
There are a couple observations we can already make here:
- We seem to be spending about 14% of our time in
ends?here, which is not quite consistent with the performance logs we have. This is because this is not the only place whereends?gets called in the call stack. - We now see that close to a 100% of our time is spent on the
countfunction, which we can deduce is the one happening under thefilter-pathtag of our performance logs. The reason for this (which you can discover either through code inspection or digging down in the profiler logs) is thatcountforces the lazy sequence that we build up with all of the operations that definepath.
In general, laziness makes it really hard to measure performance. It also
generally hurts it a bit in circumstances where it does not allow us to
short-circuit. This is one of those instances: while we use lazy constructs in
this code, mainly for the readability of for, we actually will always want to
compute the entire sequence, which means laziness is pure overhead.
The profiling results are currently displayed in order of execution, which is great if your goal is to understand the dynamic behaviour of your code, but not that great if you want to understand where time is spent, lexically, in your code. For that, one can take a look at the "reverse" view by clicking the top-left-pointing arrow:
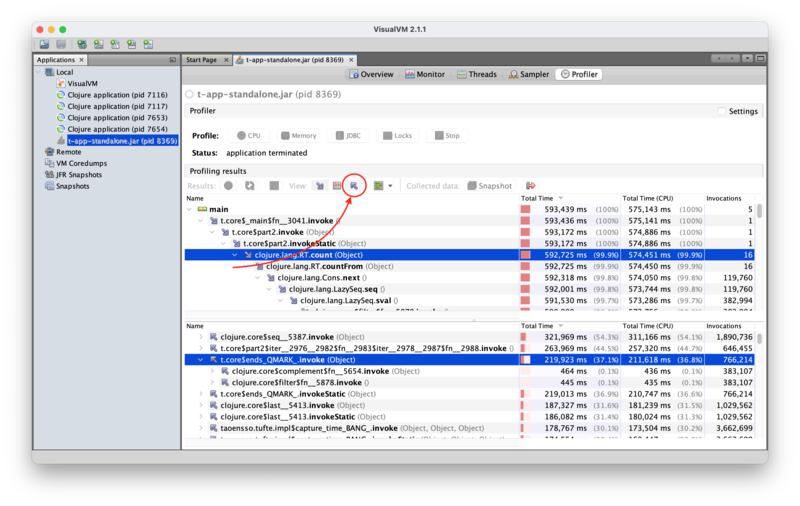
Instead of breaking down the runtime of each function by which subfunctions
they call, as in the "forward", default view, the "reverse" view tells you, for
each function, the total time spent in it, and then lets you dig down into the
various call sites. In this case, if you dig deeper, you should end up finding
that the complement line is the eventual result of the remove call under
the :remove-ends tag, while the filter line is the one under the
:filter-path one.
Unfortunately, it does not really give us any insight into which call site takes how much time.
Benchmarking
The third measurement method is benchmarking. Whereas profiling and performance logging aim at giving us some estimates of how long we spend into subforms, with the aim of understanding why a form takes however long it takes, the goal of benchmarking is to get a precise measurement of exactly how long a form takes.
In our running example, an interesting question we'll be able to answer right away is how much overhead our performance logging framework adds.
My tool of choice for Clojure benchmarking is criterium. As a first step, there are two macros you should know about:
benchmarktakes a form and an option map, and returns a map containing the results of benchmarking the form, as well as a vector of return values (one for each time it ran the form).benchis a convenience wrapper aroundbenchmarkthat prints some of that map in a human-readable form.
For example, if we change our -main function to:
(defn -main
  [& args]
  ; enable "print to stdout" adapter
  #_(tufte/add-basic-println-handler!
    {:format-pstats-opts {:columns [:total :mean :n-calls :p50 :clock]}})
  (tufte/add-handler! :my-custom-dev-null (fn [m]))
  ; give the human user a chance to start the profiler before the program
  ; starts
  (println "Waiting for profiler...")
  (read-line)
  (crit/bench
    (tufte/profile
      {}
      (let [input (p :parse
                     (-> (slurp "day12")
                         (string/split-lines)
                         parse))]
        (part2 input))))
  ; Tufte println reporting is asynchronous, and won't happen if the main
  ; thread exits the application before it's done.
  (Thread/sleep 5000)
  (flush))
It prints:
Waiting for profiler...

Evaluation count : 60 in 60 samples of 1 calls.
             Execution time mean : 2.598831 sec
    Execution time std-deviation : 292.426497 ms
   Execution time lower quantile : 2.229280 sec ( 2.5%)
   Execution time upper quantile : 3.201370 sec (97.5%)
                   Overhead used : 7.374716 ns

Found 1 outliers in 60 samples (1.6667 %)
        low-severe       1 (1.6667 %)
 Variance from outliers : 73.8431 % Variance is severely inflated by outliers
I often want to benchmark multiple expressions, with an explicit goal of
comparing them. For that, I've found the default output to not be all that
readable, and generally focus on using benchmark instead of bench and
getting the results I'm interesting in out of that.
For example, if we wanted to compare the runtimes for our current implementation with performance logging enabled, disabled, and absent, we could do something like this:
(ns t.core
  (:require [taoensso.tufte :as tufte :refer [p]]
            [criterium.core :as crit]
            [clojure.string :as string]
            [clojure.set :as set])
  (:gen-class))

(defn parse
  [lines]
  (->> lines
       (map #(string/split % #"-"))
       (mapcat (fn [[a b]] [{a #{b}} {b #{a}}]))
       (apply merge-with set/union {})))

(defn p-small?
  [^String s]
  (p :small? (= s (.toLowerCase s))))

(defn small?
  [^String s]
  (= s (.toLowerCase s)))

(defn p-ends?
  [[path _]]
  (p :ends? (= (last path) "end")))

(defn ends?
  [[path _]]
  (= (last path) "end"))

(defn p-part2
  [input]
  (loop [num-paths 0
         paths [[["start"] #{"start"} false]]]
    (if (empty? paths)
      num-paths
      (let [path (for [[path visited twice?] paths
                       next-step (p :next-step
                                    (get input (last path)))
                       :when (p :when
                                (or (not (visited next-step))
                                    (and (not= "start" next-step)
                                         (not twice?))))]
                   [(p :conj-path (conj path next-step))
                    (p :visited
                       (if (p-small? next-step)
                         (conj visited next-step)
                         visited))
                    (p :twice-check
                       (or twice?
                           (boolean (visited next-step))))])]
        (recur (p :filter-path
                  (->> path (filter p-ends?) count (+ num-paths)))
               (p :remove-ends
                  (->> path (remove p-ends?))))))))
(defn part2
  [input]
  (loop [num-paths 0
         paths [[["start"] #{"start"} false]]]
    (if (empty? paths)
      num-paths
      (let [path (for [[path visited twice?] paths
                       next-step (get input (last path))
                       :when (or (not (visited next-step))
                                 (and (not= "start" next-step)
                                      (not twice?)))]
                   [(conj path next-step)
                    (if (small? next-step)
                      (conj visited next-step)
                      visited)
                    (or twice?
                        (boolean (visited next-step)))])]
        (recur (->> path (filter ends?) count (+ num-paths))
               (->> path (remove ends?)))))))

(defn bench
  [f]
  (->> (crit/benchmark (f) {}) :mean first))

(defn -main
  [& args]
  (tufte/add-handler! :my-custom-dev-null (fn [m]))
  (let [input (-> (slurp "day12")
                  (string/split-lines)
                  parse)]
    (doseq [[tag f] [["no perf log" #(part2 input)]
                     ["disabled" #(p-part2 input)]
                     ["enabled" #(tufte/profile {} (p-part2 input))]]]
      (println (format "%15s: %.3e" tag (bench f))))))
On my laptop, this prints:
    no perf log: 1.047e+00
       disabled: 1.103e+00
        enabled: 2.440e+00
Recap
Since we have just seen three different techniques that, on the surface, seem to all answer the same basic question of "how long does this take?", it's worth taking a minute to compare and contrast them.
I use benchmarking to measure my progress while optimizing. Optimizing code usually involves a lot of attempts, and you can't really know if what you've done actually improves performance without benchmarking the before and after cases. It allows me to identify the errors in what is essentially a trial-and-error approach. And sometimes the result is quite surprising!
Performance logging and profiling are both aimed at giving a bit more insight into how and why time is spent, rather than just an overall result. Here are a few contrasting points between them:
- Profiling does not require any preparation: you can run a profiler on your code without modifying the code itself. This can be a huge advantage for larger code bases, where annotating everything of potential interest can be daunting.
- Profiling makes your code extremely slow. That's fine if you can arrange to start your profiled program and leave it running overnight or while you go out for lunch, but it's not great if you want a more interactive workflow.
- Performance logs can be added as part of your normal development cycle. The overhead of inactive performance logs is very low, and in most context will be negligible. There may even be some contexts where it is overall worth keeping the enabled all the time in production, because knowing what's going on can be more important than a constant factor.
- Profiling basically disables the JIT. Performance logging may also interact with the JIT in some ways (it's adding code and side effects, so the JIT may end up making different decisions), but to a much lesser extent.
- Performance logging relies on you putting your
ptags (or equivalent if not using tufte) at the appropriate places. Profiling lets you dig as deep as you want on each function call.
What's next?
I have quite a bit more to say about optimizing Clojure code, but getting reasonably proficient with the three techniques outlined above is the foundation for any serious performance optimization effort in Clojure. If you're working with a different language I don't know why you've read this far, but you should seek out similar tools for your language of choice.
I recommend trying these out on Advent of Code or Project Euler types of problems (or any other collection of programming puzzles you like): past the first few, these projects are usually complex (and slow!) enough that applying the above techniques gets interesting and rewarding, while still being self-contained, in that they're never shipping to production. You can optimize them to the best of your abilities and flex your muscles and develop your instincts about performance, in a "safe" environment where you don't have to worry about the loss of mainainability that comes with some optimizations.
The goal here is that it wille enable you to make more informed decisions later on. You shouldn't always strive to write the most efficient code possible, but, generally speaking, when you write inefficient code, it should ideally be a conscious choice of optimizing for something else.
Next time, I'll work through how I'd iteratively use these three techniques in order to improve the performance of my AoC day 12 solution.